
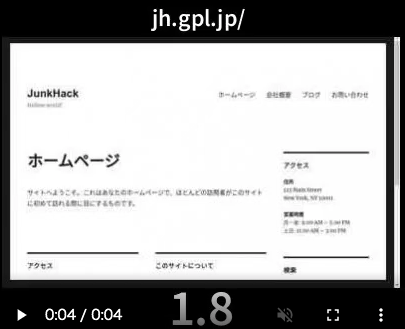
さて、今回はメモ程度ですが スマホUMIDIGI F2に、termuxでapache2とphp7とmariadb10を入れた環境にWordPress代替えのClassicPressを入れて動作させてみました。いろいろ課題が見えて来たのでメモしておきます。まずは、どのくらいの速度で表示されるか、視覚的に見ると以下になります。約1.8秒です。
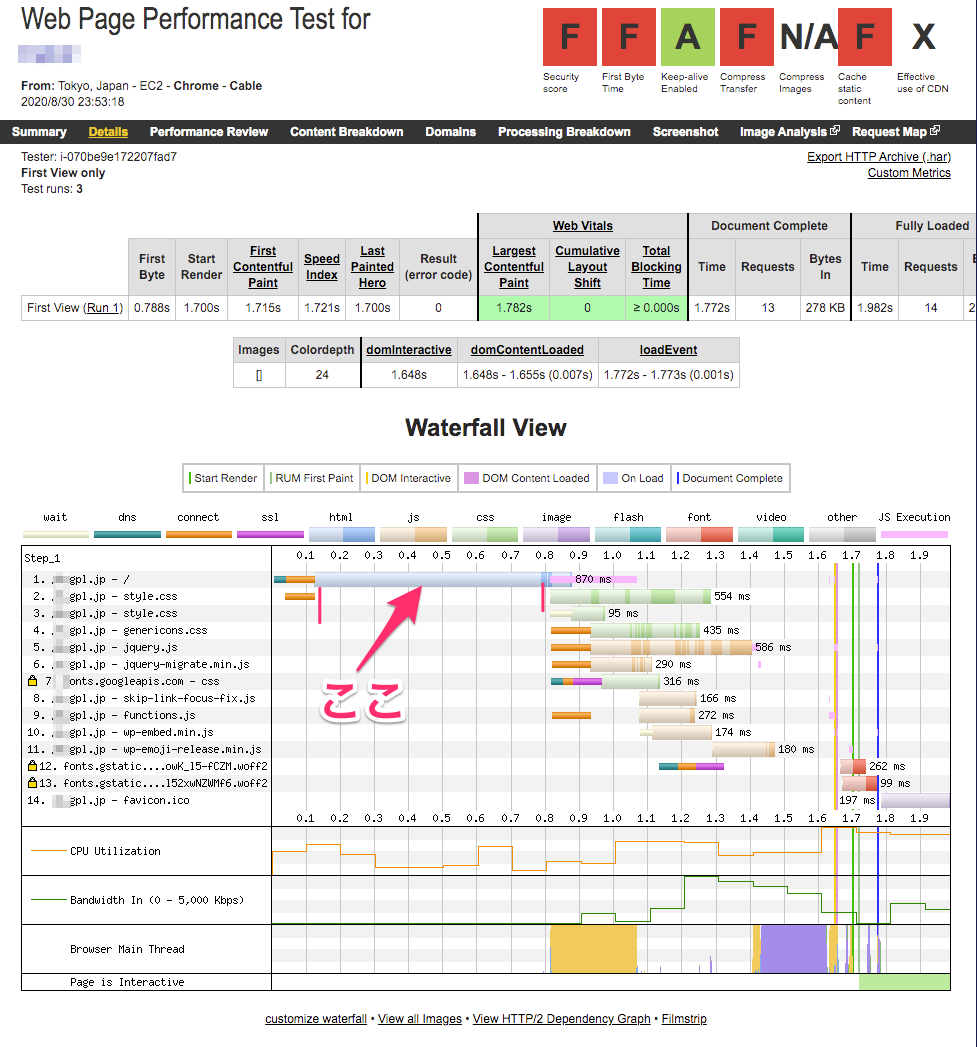
これは、後ほど出て来ますが https://www.webpagetest.org/ でのテスト結果です。ちょっと遅いですよね。まぁ、しかしスマホで動作していると思えば十分に速いかもしれません。
まだ設定は未調整ですがhttp接続(SSLじゃない80接続)でのベンチマークです。コマンドラインでのapache ab テストもやってみました。同時に100ユーザが、1ユーザーあたり10リクエストを発行した場合を想定しています。これは、一般的なhtmlアクセスに対するjsやcssや画像のアクセスかなと思います。まぁ、このブログはそんな人気じゃないので同時に10人くらいのアクセスで十分かもですがw
サーバ側の状態は、ClassicPressをデフォルトで入れた状態です。テーマは、ClassicPressのTwentySixteenです。画像は出ない状態で全部テキストです。htmlやcssやjsやfontなど全部で、278 KBです。
まず、ローカルのリモート(macos)から。
$ ab -n 1000 -c 100 http://192.168.1.38:8080/
Server Software:        Apache/2.4.46
Server Hostname:        192.168.1.38
Server Port:            8080

Document Path:          /
Document Length:        15825 bytes

Concurrency Level:      100
Time taken for tests:   78.390 seconds
Complete requests:      1000
Failed requests:        0
Total transferred:      16123000 bytes
HTML transferred:       15825000 bytes
Requests per second:    12.76 [#/sec] (mean)
Time per request:       7839.037 [ms] (mean)
Time per request:       78.390 [ms] (mean, across all concurrent requests)
Transfer rate:          200.86 [Kbytes/sec] received

Connection Times (ms)
              min  mean[+/-sd] median   max
Connect:        1    4  15.5      1     410
Processing:   490 7663 5599.2   6405   30174
Waiting:      461 7317 5486.8   5962   30109
Total:        494 7667 5599.1   6407   30175

Percentage of the requests served within a certain time (ms)
  50%   6407
  66%   7733
  75%   9622
  80%  10952
  90%  16804
  95%  19520
  98%  24822
  99%  26571
 100%  30175 (longest request)
次は、GCPの東京リージョンからです。この経路は80←→8080にポート転送していますが、その差は感じない程度ですね。termux は、80ポートや443ポートでは運用できない制限がありますので、ルータで変換します。
$ ab -n 1000 -c 100 http://jh.gpl.jp/
Server Software: Apache/2.4.46
Server Hostname: jh.gpl.jp
Server Port: 80

Document Path: /
Document Length: 15742 bytes

Concurrency Level: 100
Time taken for tests: 78.813 seconds
Complete requests: 1000
Failed requests: 0
Total transferred: 16040000 bytes
HTML transferred: 15742000 bytes
Requests per second: 12.69 [#/sec] (mean)
Time per request: 7881.291 [ms] (mean)
Time per request: 78.813 [ms] (mean, across all concurrent requests)
Transfer rate: 198.75 [Kbytes/sec] received

Connection Times (ms)
min mean[+/-sd] median max
Connect: 21 190 525.8 51 3058
Processing: 707 7470 4143.1 7264 22358
Waiting: 605 7100 4070.2 6790 22218
Total: 804 7661 4221.0 7341 22409

Percentage of the requests served within a certain time (ms)
50% 7341
66% 8008
75% 8490
80% 9059
90% 14244
95% 16246
98% 20310
99% 21250
100% 22409 (longest request)
次はtermuxが動作しているローカルからです。
$ ab -n 1000 -c 100 http://192.168.1.38:8080/
Server Software: Apache/2.4.46
Server Hostname: 192.168.1.38
Server Port: 8080

Document Path: /
Document Length: 15825 bytes

Concurrency Level: 100
Time taken for tests: 77.274 seconds
Complete requests: 1000
Failed requests: 0
Total transferred: 16123000 bytes
HTML transferred: 15825000 bytes
Requests per second: 12.94 [#/sec] (mean)
Time per request: 7727.448 [ms] (mean)
Time per request: 77.274 [ms] (mean, across all concurrent requests)
Transfer rate: 203.76 [Kbytes/sec] received

Connection Times (ms)
min mean[+/-sd] median max
Connect: 1 1428 791.4 1531 3535
Processing: 562 6046 2311.5 5785 16840
Waiting: 515 4357 2249.9 3816 16085
Total: 649 7474 2189.4 7356 17166

Percentage of the requests served within a certain time (ms)
50% 7356
66% 8082
75% 8376
80% 8620
90% 9861
95% 11707
98% 12754
99% 13209
100% 17166 (longest request)
ちなみに、ローカルのリモート(macos)からしか試していませんが、スマホの接続をWiFi接続を5Ghzではなく、2.4Ghzで接続した場合は以下でした。これ有線だとどうなるんでしょうかね。type-c と有線イーサネットは1つありますが、繋げても接続できなかったのでまだテストしていません。
Server Software: Apache/2.4.46
Server Hostname: 192.168.1.38
Server Port: 8080

Document Path: /
Document Length: 15825 bytes

Concurrency Level: 100
Time taken for tests: 84.280 seconds
Complete requests: 1000
Failed requests: 0
Total transferred: 16123000 bytes
HTML transferred: 15825000 bytes
Requests per second: 11.87 [#/sec] (mean)
Time per request: 8427.984 [ms] (mean)
Time per request: 84.280 [ms] (mean, across all concurrent requests)
Transfer rate: 186.82 [Kbytes/sec] received

Connection Times (ms)
min mean[+/-sd] median max
Connect: 1 11 13.3 5 135
Processing: 491 7692 4699.6 7107 25513
Waiting: 443 7301 4611.2 6657 25511
Total: 493 7703 4700.0 7139 25514

Percentage of the requests served within a certain time (ms)
50% 7139
66% 8172
75% 9108
80% 10369
90% 14578
95% 18137
98% 20897
99% 22101
100% 25514 (longest request)
多少、劣るようですがそこまで気にしなくてもいいかもです。
それよりも、最初のhtmlのロードが長いです。以下は一番最初のビデオの状態を詳細にみた結果です。まだ圧縮転送やキャッシュは効かせていませんが、マシン性能が出る部分ですかね。ちょっと遅いです。NGINXだともう少し速くなるかもですので、また試してみたいと思います。
このWEBページのindex相当になるファイルはサイズ、15kb程度です。例えば、phpinfoのページを読んだ結果は以下です。このページは、82.0 KBありますが、0.4秒で終わっています。
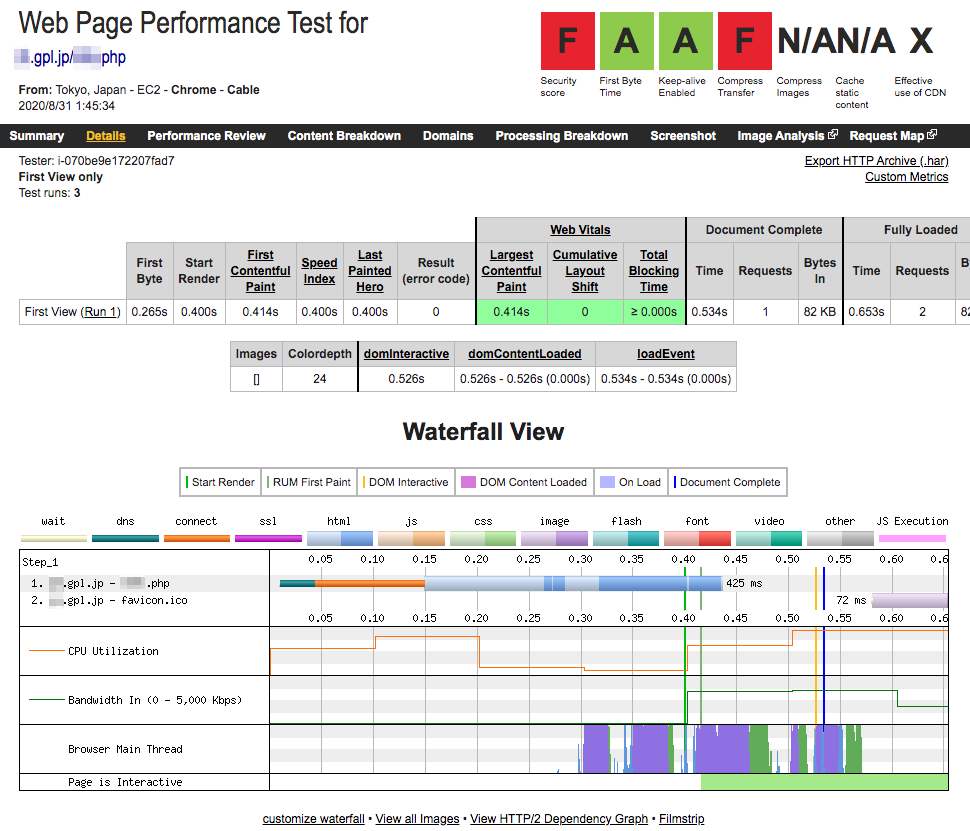
つまり、mariadbにアクセスしたりphpでのwordpressの処理時間がかかっているから遅くなっているということになりますね。
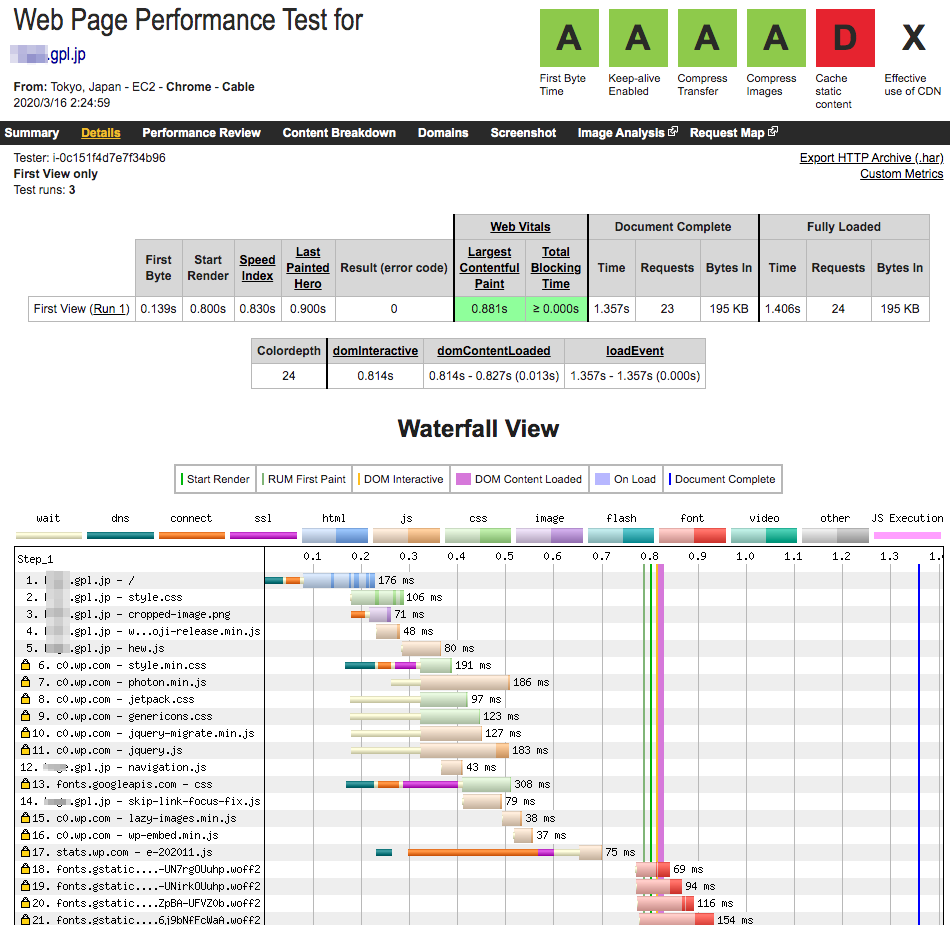
例えば、これは以前検討していたマシンでの結果ですが、htmlのロードは0.2秒以内に終わっています。UnixBenchが7000近く出るマシンでネットワークもIPv4→IPv6トンネルなので、比較するとあれですが、どこまで近づけるかですね。
まぁ、速度的なことより困っていることがあります。それは、ローカルのマシンから、termux上で動作しているwordpressにグローバルIPでアクセスできないことです。この場合、ルータの管理画面にアクセスしちゃうんで、どうしようかなと。こういうのなんていうんでしたっけか? とにかく、今の拠点のルータ(PR-400KI)は、内側ネットワークから外側のグローバルアドレスにアクセスしたものを、変換(最終的にサーバのプライベートアドレスに変換)してくれないのです。
プライベートアドレスだと、wordpressの設定で、グローバルのIPがマッピングされているドメイン名の設定になっているので(ルータで80と8080をポート転送してwordpressを運用)、リダイレクトされてアクセスできないんですよね。これはwordpress の仕様みたいなので回避不可能かなと。なんか言葉で書くとわかりにくいですね。今度、時間があるときに図解で問題点を明確にしたいです。
今の所、2案あります。1つは、マルチセッションを貼って違う光プロバイダーからアクセスさせる方法。もう一つは、リバースプロキシを経由させる方法です。
スマホで非ルートで動かすtermux は、IPテーブルとかルーティングとかいじれないので工夫が必要ですね。
ネットワークはあんまり得意じゃないんで、もっといい解決方法があるかもしれませんが。
ピンバック: ポートフォワードの経路で、Uターン NATとかヘアピンNATが使えないルータの場合のあれこれ – アリエクでポチった JunkHack